Research
Interactive figures from my work across climate science, astrophysics, and data visualization.
Climate & Agriculture
As an AWS Climate Data Science Fellow, I'm building HarvestStat, the world's most comprehensive dataset of subnational crop yield data. This work couples remote sensing with ground-based agricultural observations to understand how climate dynamics shape yield responses globally.
Crop Status Dashboard
Selected Publications
- HarvestStat: a global effort towards open and standardized sub-national agricultural data — Davis, Anderson, ..., Foley et al. (2025), Environmental Research Letters
3D Interstellar Medium & Star Formation
A central thread of my research maps the three-dimensional structure of gas and dust in the solar neighborhood. We discovered that all nearby star formation occurs on the surface of the Local Bubble, an expanding superbubble, and built some of the first interactive 3D maps of the Orion star-forming complex.
The Local Bubble
An expanding supershell ~1,000 light-years across, driven by supernovae over the past ~14 Myr. Star-forming regions sit on its surface. From Zucker, Goodman, Alves, Bialy, Foley et al. (2022). Drag to rotate.
The Radcliffe Wave Is Oscillating
A 9,000 light-year sinusoidal chain of molecular clouds, the largest coherent gas structure in the Galaxy, oscillating through the Galactic plane. From Konietzka, Goodman, Zucker, ..., Foley et al. (2024). Drag to rotate; click legend items to toggle layers.
Orion in 3D: Barnard's Loop & the Orion Complex
The first interactive 3D map of the Orion star-forming complex that connects molecular clouds, young stars, and the arc of Barnard's Loop. From Foley, Goodman, Zucker et al. (2023). Drag to rotate.
Selected Publications
- Star formation near the Sun is driven by expansion of the Local Bubble — Zucker, Goodman, Alves, Bialy, Foley et al. (2022), Nature
- The Radcliffe wave is oscillating — Konietzka, Goodman, Zucker, ..., Foley et al. (2024), Nature
- A 3D View of Orion. I. Barnard's Loop — Foley, Goodman, Zucker, Forbes, Konietzka, Swiggum (2023), The Astrophysical Journal
- The Per-Tau Shell: a giant star-forming spherical shell revealed by 3D dust observations — Bialy, Zucker, Goodman, Foley et al. (2021), ApJ Letters
- On the three-dimensional structure of local molecular clouds — Zucker, Goodman, Alves, Bialy, Koch, Speagle, Foley et al. (2021), ApJ
- Evidence for radial expansion at the core of the Orion complex with Gaia EDR3 — Swiggum, D'Onghia, Alves, Grossschedl, Foley, Zucker (2021), ApJ
- The passage of the Solar System through the edge of the Local Bubble — Opher, Loeb, Zucker, Goodman, Konietzka, ..., Foley (2024), ApJ
Supernovae & Cosmology
I contributed to the Pantheon analysis, the largest combined sample of Type Ia supernovae used to measure the expansion history of the Universe, and co-led the Foundation Supernova Survey, a low-redshift anchor for cosmological distance measurements from a single, well-calibrated telescope. I also computed (at the time) the tighest constraints on the production of the first elements (hydrogen, helium, and lithium) after the Big Bang.
Hubble Diagram
Distance modulus vs. redshift for the full Pantheon sample of 1,048 Type Ia supernovae, illustrating the accelerating expansion of the Universe. From Scolnic, Jones, ..., Foley et al. (2018).

Selected Publications
- The complete light-curve sample of spectroscopically confirmed SNe Ia from Pan-STARRS1 and cosmological constraints from the combined Pantheon sample — Scolnic, Jones, ..., Foley, M., ..., et al. (2018), ApJ
- The Foundation Supernova Survey: motivation, design, implementation, and first data release — Foley, R. J., Scolnic, ..., Foley, M. M., et al. (2018), MNRAS
- The Foundation Supernova Survey: measuring cosmological parameters with supernovae from a single telescope — Jones, Scolnic, Foley, R. J., ..., Foley, M. M., et al. (2019), ApJ
- Should Type Ia supernova distances be corrected for their local environments? — Jones, Riess, Scolnic, Pan, Johnson, Coulter, ..., Foley (2018), ApJ
- Revised Uncertainties in Big Bang Nucleosynthesis — Foley, Sasankan, Kusakabe, Mathews (2017), ApJ
Turbulence & Fluid Dynamics
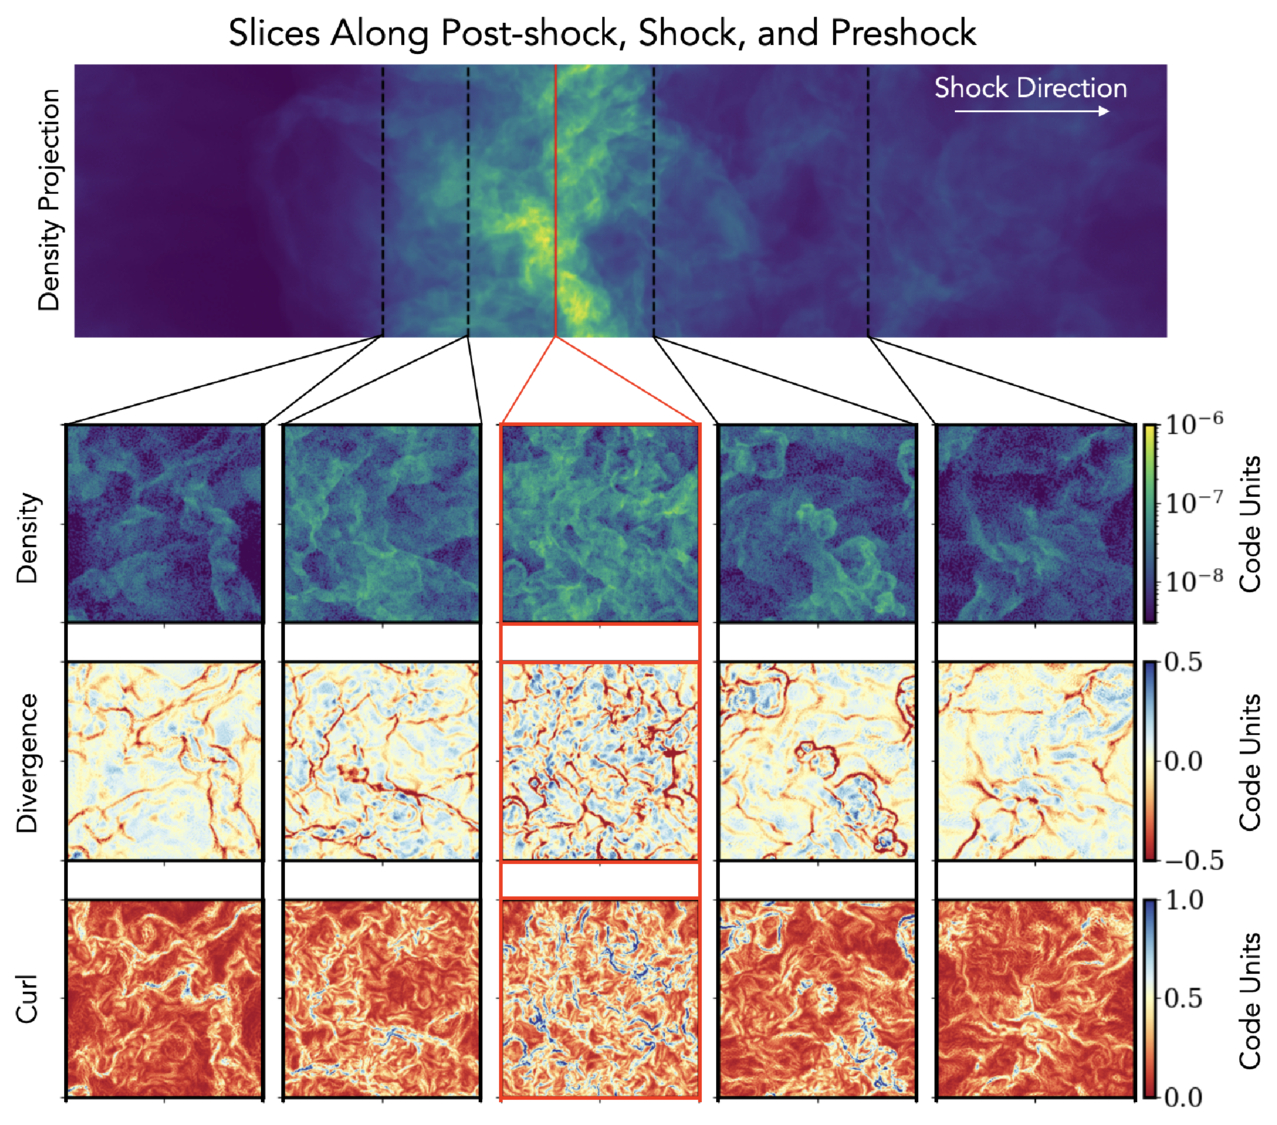
My Ph.D. thesis focused on how shock waves interact with turbulence in star-forming molecular clouds. Using magnetohydrodynamic simulations, I studied how post-shock gas develops turbulent structure across spatial scales and how this affects the conditions for gravitational collapse and star formation.
Post-Shock Turbulence Power Spectrum
3D kinetic energy power spectra of the pre-shock and post-shock regions for a Mach 15 shock passing through supersonic turbulence. From Foley, Mocz, Burkhart, Hernquist, Goodman (2025).
Selected Publications
- Development of Turbulence in Postshock Regions — Foley, Mocz, Burkhart, Hernquist, Goodman (2025), The Astrophysical Journal
Data Visualization
I'm a contributor to glue, a Python package for linked-data visualization used by astronomers and Earth scientists worldwide. Every interactive 3D figure on this page was exported using glue's Plotly plugin. In collaboration with the AAS and Delightex, we published the first augmented reality figure in an astronomy journal. Scan the QR code below to make the Per-Tau Shell float over your desk.
The Per-Tau Shell: First AR Figure in Astronomy
Interactive 3D view of the Per-Tau Shell, a 156 pc diameter star-forming superbubble embedding Perseus and Taurus. From Bialy, Zucker, Goodman, Foley et al. (2021). Drag to rotate, or scan the QR code on your phone to view in augmented reality.
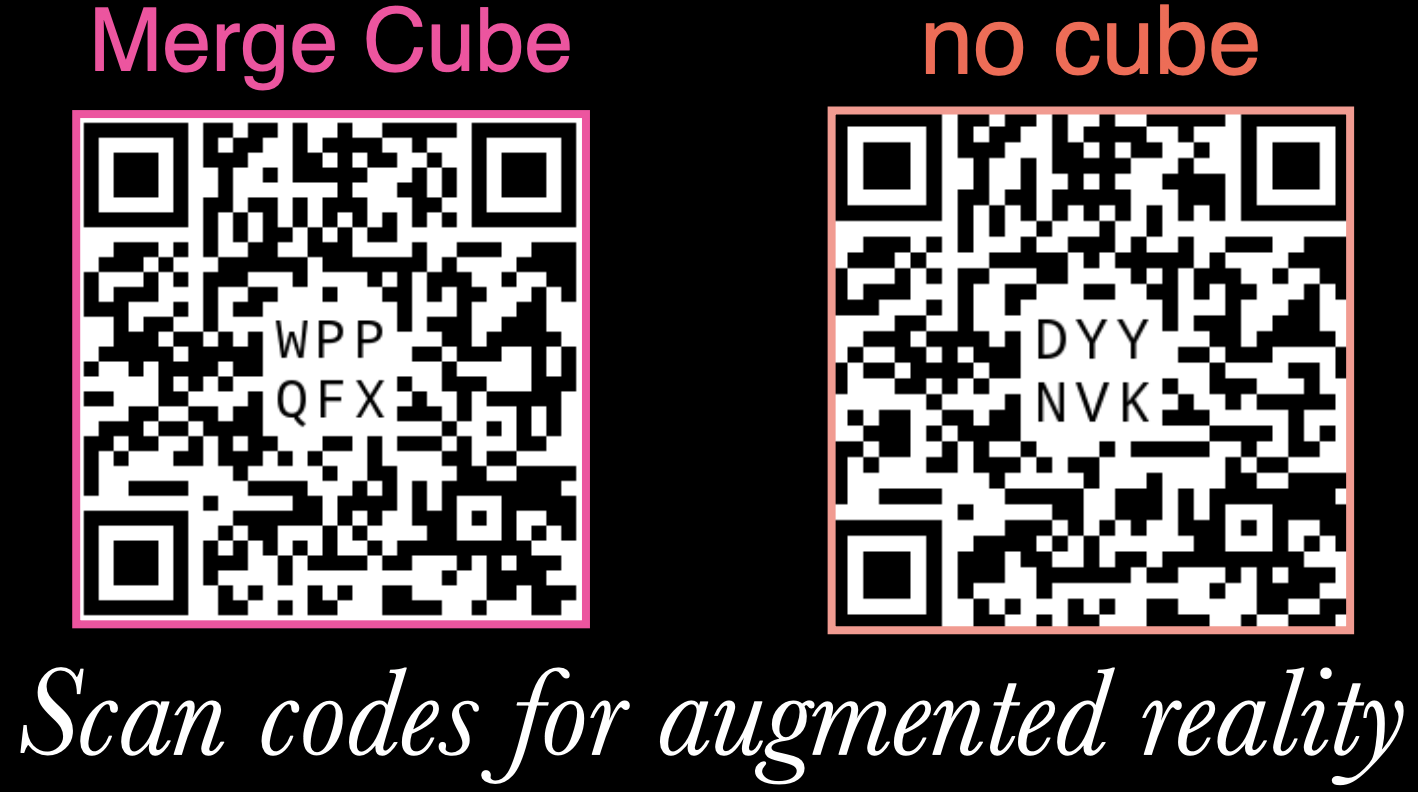
Scan to view in AR
Selected Publications
- Improving undergraduate astronomy students' skills with research literature via accessible summaries — Lewis, Waggoner, Clarke, ..., Foley et al. (2025), Phys. Rev. Physics Education Research
- The Per-Tau Shell: a giant star-forming spherical shell revealed by 3D dust observations — Bialy, Zucker, Goodman, Foley et al. (2021), ApJ Letters